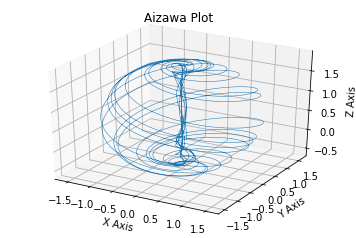
- Code: Select all
import matplotlib.pyplot as plt

# Read data from file
with open('data.txt', 'r') as file:
    data = file.read().splitlines()

# Convert data to integers or floats
data = [int(i) for i in data]  # or use float(i) if your data contains decimals

# Plot the data
plt.plot(data, marker='o')
plt.title('Plot from File Data')
plt.xlabel('Index')
plt.ylabel('Value')
plt.show()
Load and Plot
1 post
• Page 1 of 1
Load and Plot
- hbyte
- Site Admin
- Posts: 142
- Joined: Thu Aug 13, 2020 6:11 pm
1 post
• Page 1 of 1
Who is online
Users browsing this forum: No registered users and 14 guests
